Cricket Data Analysis Using Power BI
The Cricket Data Analysis Project uses web scraping to collect real-time cricket data, preprocesses it with Pandas, and presents insights in an interactive Power BI dashboard. Users can explore player comparisons, team performance, and key metrics to make data-driven decisions when building cricket teams.
Services:
- Dashboard
- Power BI
Client:
Personal
Project link:
https://github.com/MorshedulHoque/Cricket-Data-AnalysisDuration:
N/A
The Cricket Data Analysis Project is a powerful tool that utilizes web scraping and data preprocessing techniques to create a comprehensive dashboard for cricket enthusiasts. The project aims to assist users in forming a high-performing cricket team by analyzing various statistical metrics.
Data Collection
The project leverages BeautifulSoup to scrape cricket-related websites and extract valuable data in the form of JSON files. These files contain detailed information about matches, players, teams, and other relevant aspects of the game. By automating the data collection process, the project ensures that the dashboard remains up-to-date with the latest statistics.
Data Preprocessing
The collected data undergoes preprocessing using the powerful Pandas library to ensure accurate and reliable analysis. This step involves cleaning the data, handling missing values, and transforming the dataset into a suitable format for further analysis. By employing various preprocessing techniques, the project guarantees the integrity and quality of the data used in the dashboard.
Dashboard Creation
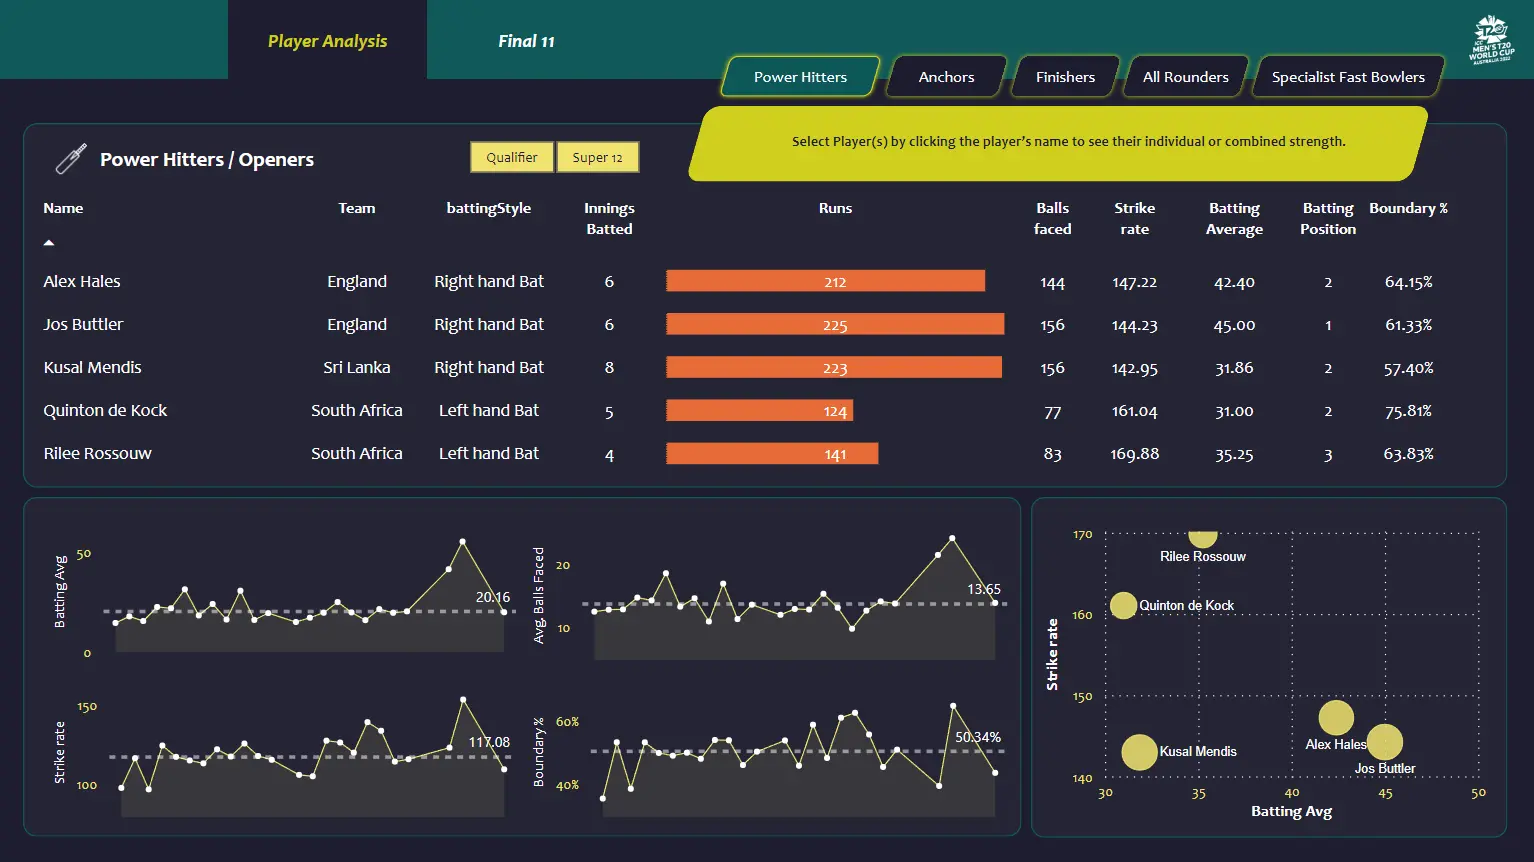
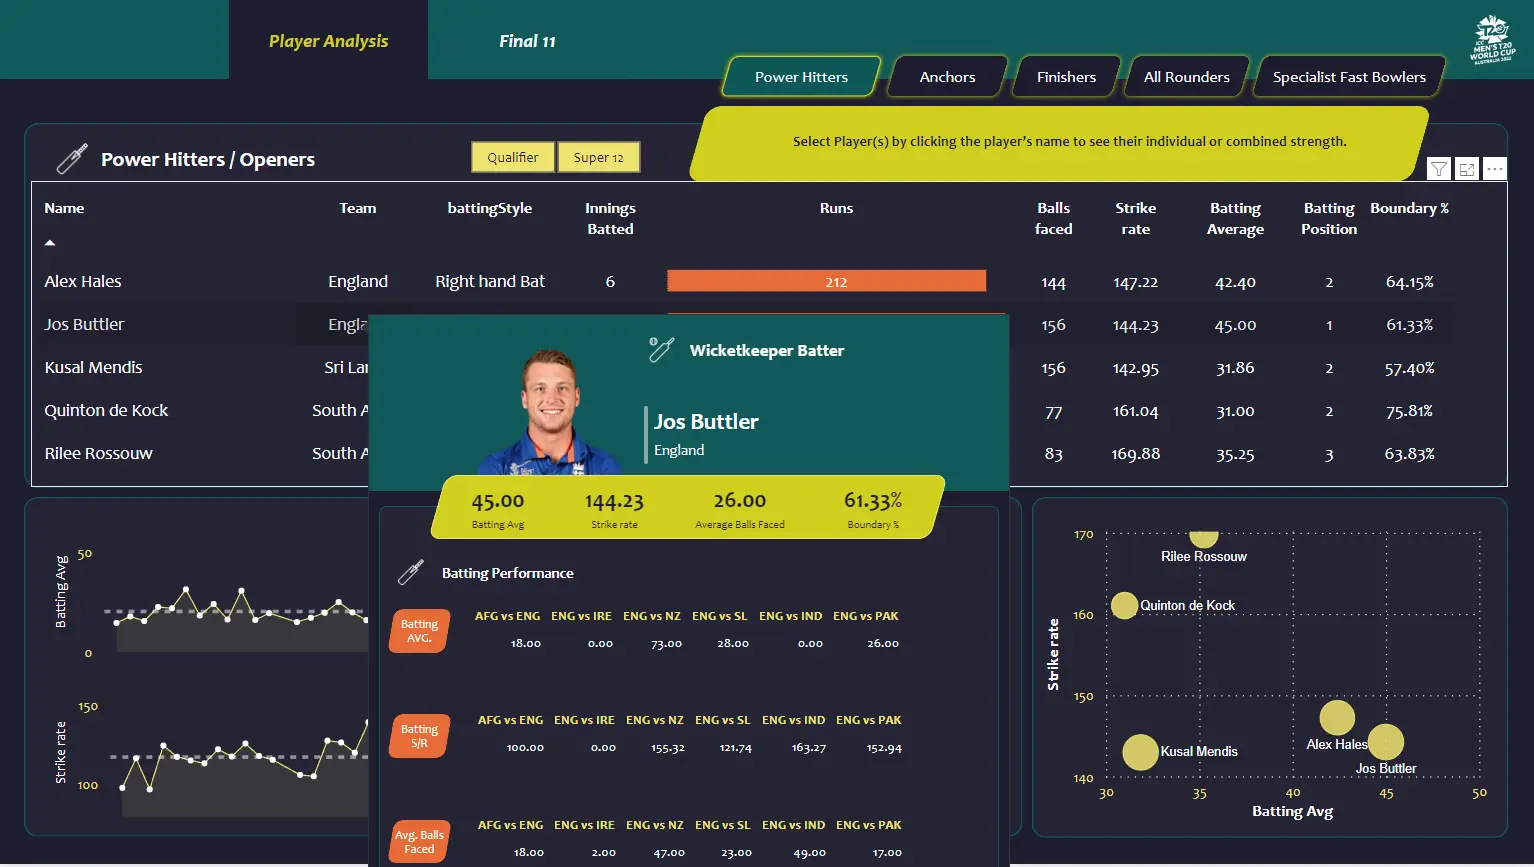
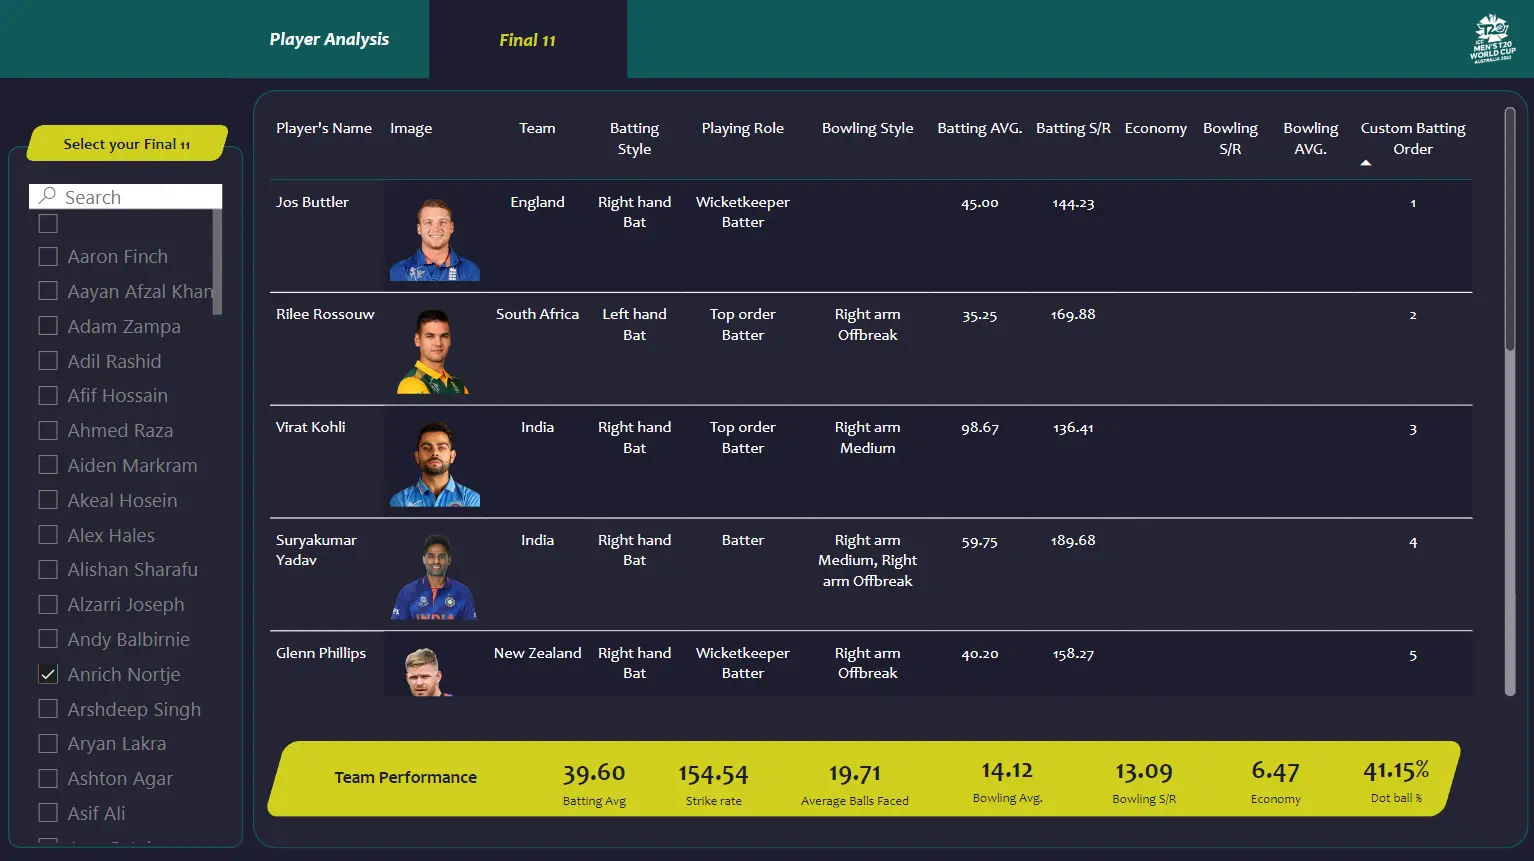
The core component of the Cricket Data Analysis Project is the creation of an intuitive and visually appealing dashboard using Power BI. The dashboard provides users with a range of interactive visualizations and insightful metrics, enabling them to make data-driven decisions when building their cricket team. The user-friendly interface allows users to explore different parameters, compare players and teams, and identify trends and patterns in the data.
Key Features
- Web Scraping: Utilize BeautifulSoup for efficient data extraction from cricket websites.
- Data Preprocessing: Employ pandas to clean, format, and transform the data for analysis.
- Interactive Dashboard: Create a visually appealing and user-friendly dashboard for data exploration.
- Player Comparison: Enable users to compare player performance by various statistical measures Power BI.
- Team Performance Analysis: Provide insights into team performance based on key metrics and historical data.